A R1m house purchased in 2017 would have cost nearly 12 bitcoin. The value of that house has fallen to less than 1.5 bitcoin today. From Moneyweb.

A R1 million house bought in 2017 would have cost just shy of 12 bitcoin (BTC).
Today, the value of that property is 1.44 BTC after allowing for increases in residential property values as tracked by Stats SA.
SA house prices are already considered cheap relative to many overseas markets, but they are even cheaper when measured in bitcoin.
The chart below shows the deflationary power of BTC since 2017. BTC broke $70 000 last week and hit all-time highs in some currencies – though not when measured in rand, which has been strengthening against the US dollar in recent months.
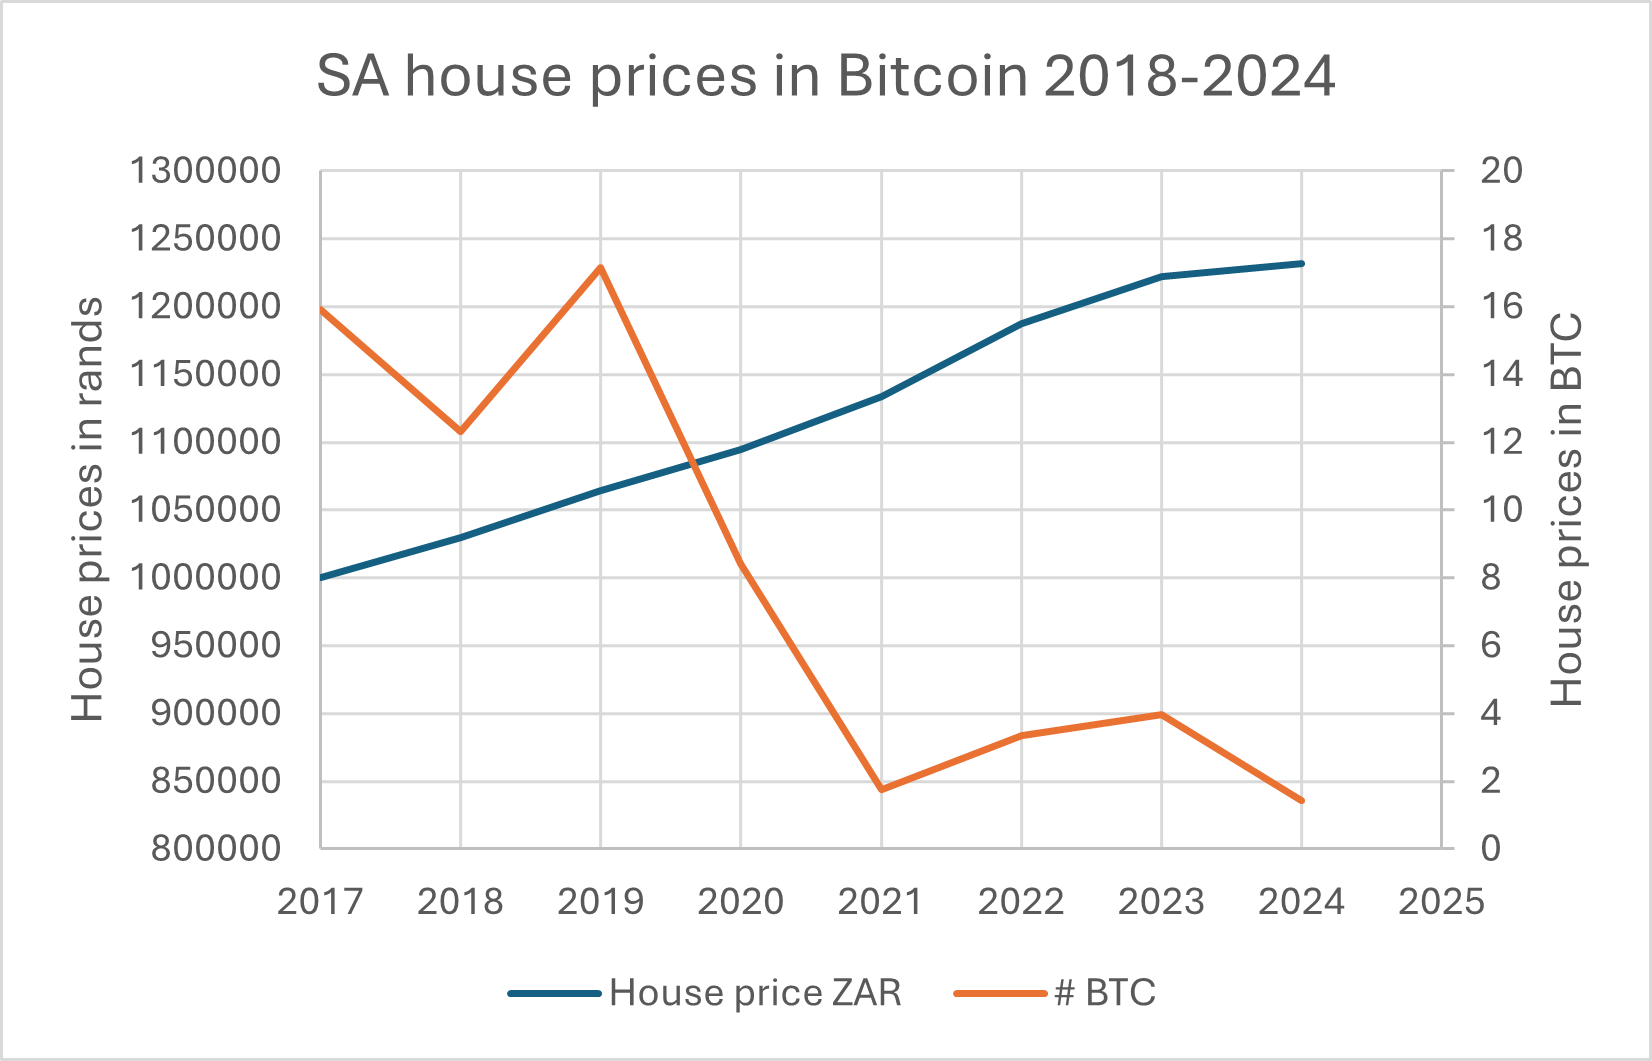
Expressed another way, if you invested your R1 million in BTC in January 2017 rather than a house, you would have 15.9 BTC, today worth R19.5 million.
That’s assuming you purchased the house entirely with cash. Most people will use bank finance, perhaps with a cash down payment of 10%, not counting conveyancing and other fees.
Even then, it can take years for young people to accumulate sufficient savings for the down payment.
It’s a method of wealth creation that has worked well historically and is also a way to use bank loans to finance your bitcoin journey.
Time for bitcoin deposits?
“Maybe it’s time to save for that down payment in bitcoin instead of dollars. Setting aside a steady amount in bitcoin each month over a five year period may be the difference between comfortably affording a home versus being priced out of the market,” says Jonny Reck, a bitcoin and real estate investor who has developed strategies to acquire real estate using bitcoin.
These strategies will not suit everyone’s risk profile, but one method involves using cash flow from rental properties, net of operational costs, to acquire BTC monthly and harvesting the home equity periodically to acquire more BTC.
This is known as dollar-cost averaging, where BTC is acquired monthly, regardless of price.
The prices reflected in the chart above are skewed by the massive 2017-2018 bull market and the subsequent bull market starting in 2023.
The value of the house shown above has appreciated nearly 20% since March 2017. Bitcoin’s price has gone up 81 times over the same period, making it far and away the best-performing asset of the last seven years.
The following chart shows US median house selling prices. Looking at historical house prices in this manner explains the deflationary power of BTC rather than focusing on its potential for profit gains.
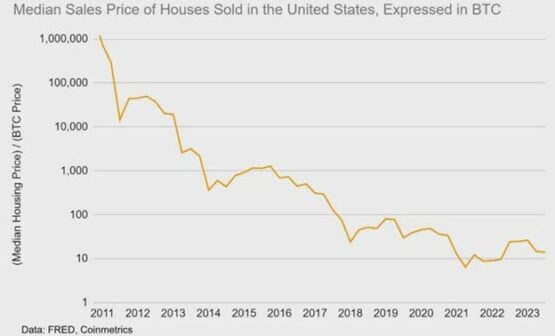
By way of comparison, if you bought a R1 million house in SA in 2011, you would have paid 1 517 BTC – worth R1.87 billion today.
We have ignored the earlier years of BTC’s life, focusing only on those years since 2017.
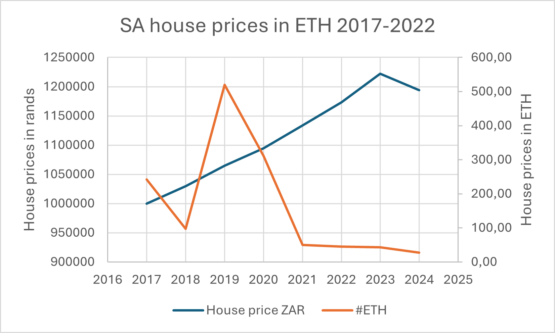
The chart below shows SA house prices in ethereum (ETH).
Read: SA house prices, measured in bitcoin, nearly doubled in 2022 [Jan 2023]
A R1 million house purchased in 2017 would have cost the equivalent of 242 ETH. That same house, allowing for increases in residential property values, is today worth nearly R1.2 million or 27.5 ETH.
Ethereum’s price in rands has increased nearly 19 times since 2017, not nearly as spectacular as BTC but far more impressive than the roughly 20% increase in average residential house prices over the period.
ETH has underperformed BTC in recent months due to relatively weak institutional demand following the authorisation of spot ETH exchange-traded funds in the US.